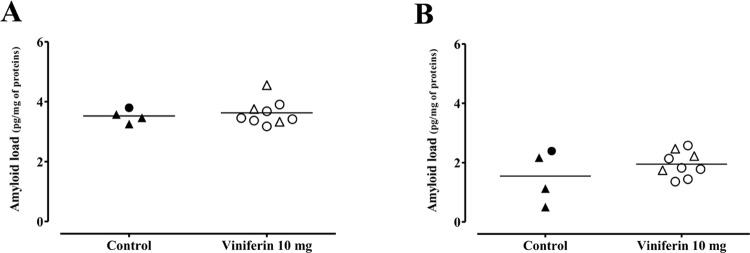
Fig 3. Effects of trans ε-viniferin at 10 mg/kg on amyloid load.
For each group of mice, levels of Aβ42 in cortex (Fig 3A) and in hippocampus (Fig 3B) were quantified using ELISA kit. The line represents the mean of 4 to 9 mice in each group, expressed as pg of Aβ42/mg of proteins. To compare values between untreated APPswePS1dE9 mice and APPswePS1dE9 mice treated with trans ε-viniferin, Mann-Whitney test was used but no statistical difference was observed.

