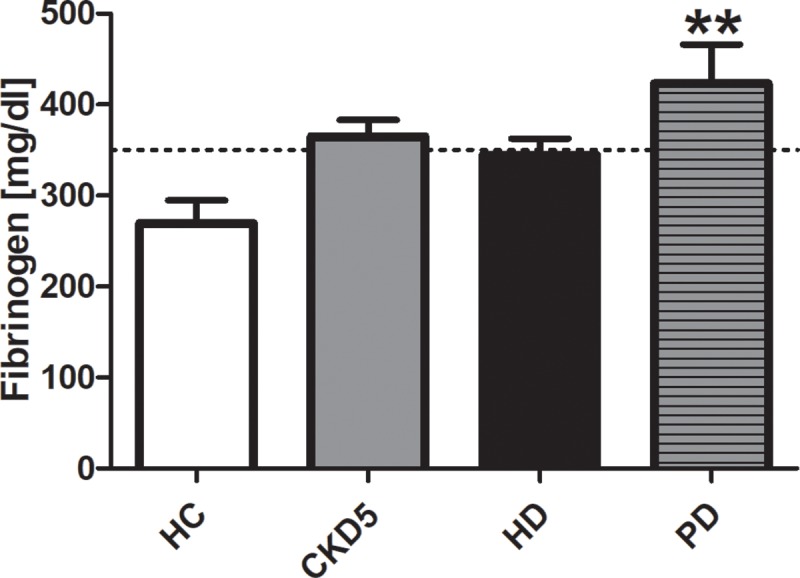
Fig 2. Fibrinogen.

Values are given as mean ± standard error of the mean for each group. Dotted line marks upper normal range. **p < 0.01 vs. HC. HC healthy control, CKD5 patients with chronic kidney disease stage G5, HD patients on hemodialysis, PD patients on peritoneal dialysis.
