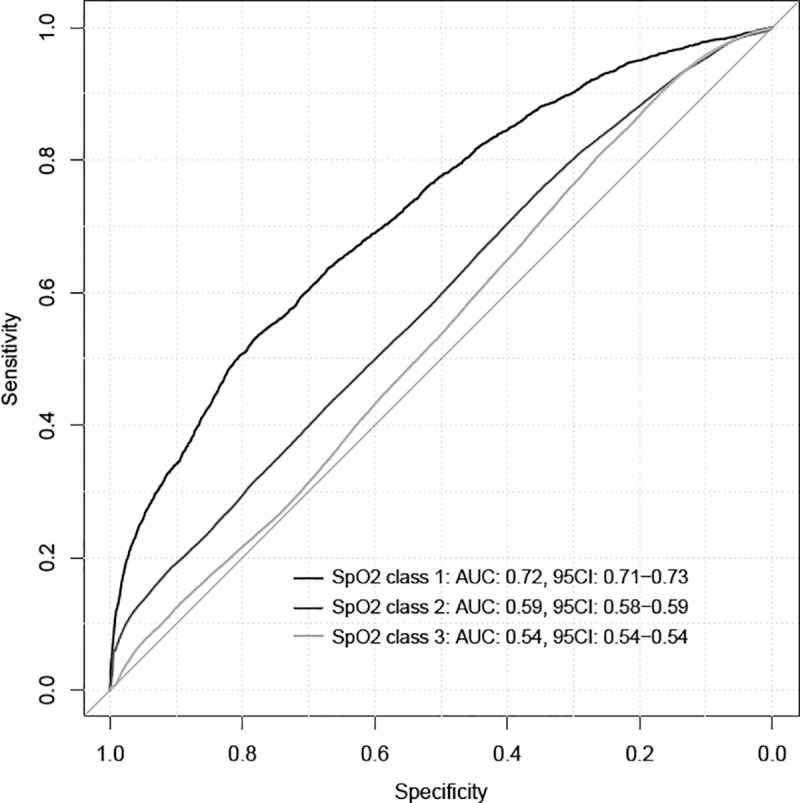
Fig 2. ROC curve for each SpO2 prediction at 5 min following a ventilator setting change of the best predictive model (bootstrap aggregation of complex decision trees (BACDT) classifiers on Test Dataset 3).

Class 1: 5 minSpO2 < 84%, class 2: 5 minSpO2 between 85% and 91%, class 3: 5 minSpO2 between 92% and 100%. AUC: area under the curve, 95IC: 95% confidence interval.
