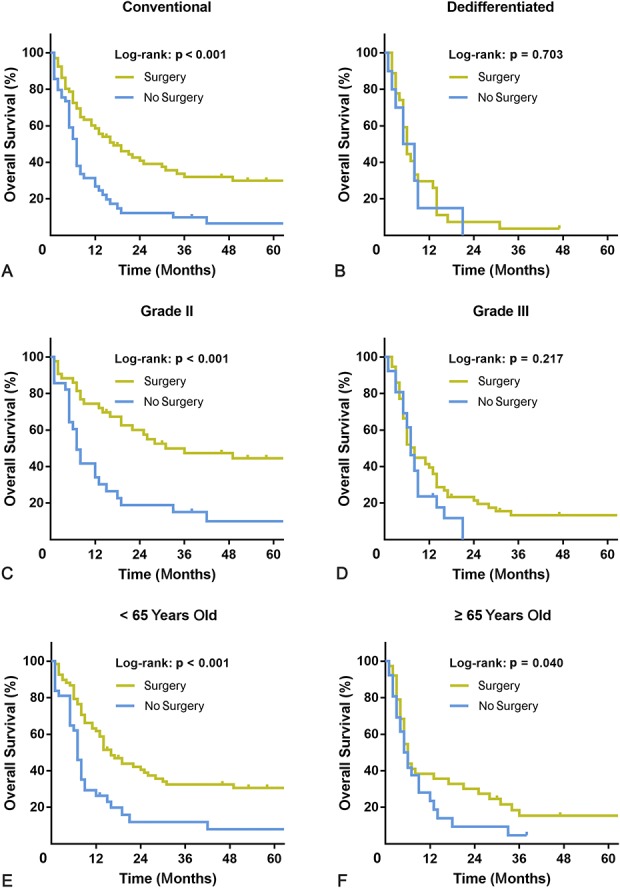
Fig. 3 A-F.

The graphs show Kaplan-Meier curves of overall survival according to whether patients underwent primary tumor surgery in (A) the conventional subtype, (B) dedifferentiated subtype, (C) Grade II malignancy, (D) Grade III malignancy, (E) patients < 65 years old, or (F) patients ≥ 65 years old.
