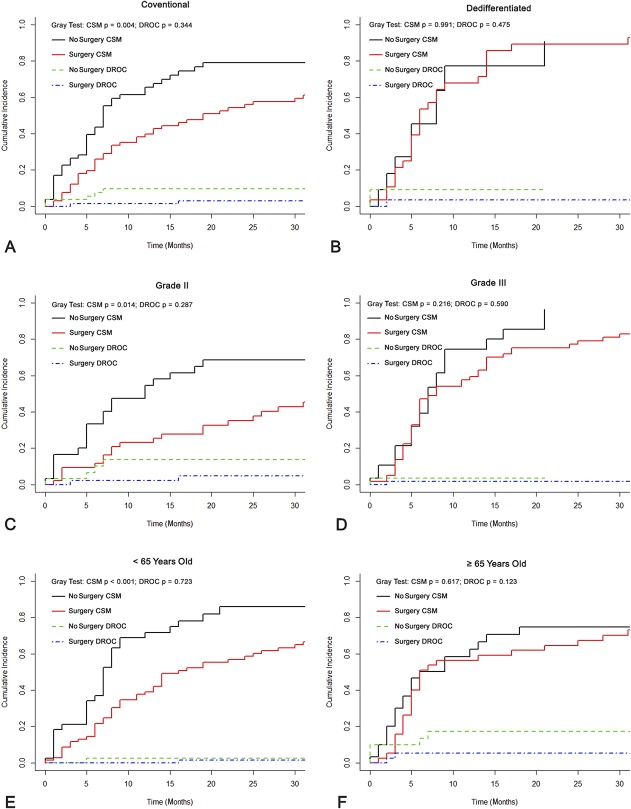
Fig. 4 A-F.
The graphs show cumulative incidence curves of cancer-specific survival according to whether patients underwent primary tumor surgery in (A) the conventional subtype, (B) dedifferentiated subtype, (C) Grade II malignancy, (D) Grade III malignancy, (E) patients < 65 years old, or (F) patients ≥ 65 years old. CSM = cancer-specific mortality; DROC = death resulting from other causes.

