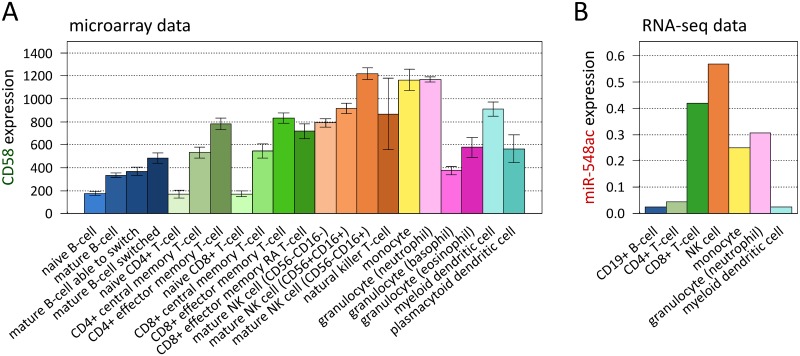
Fig 6. Expression of CD58 and microRNA-548ac in different immune cell populations.
Cell type-specific expression was analyzed using public data on purified cell subpopulations of the blood. (A) This bar plot depicts the mean transcript levels of CD58 in 21 cell populations (shown in different colors) as measured by Novershtern et al. using microarrays [35]. The subpopulations were separated from peripheral blood samples of healthy subjects using cell surface markers. CD58 was expressed at high levels in monocytes and neutrophils as well as in subsets of T-cells, natural killer (NK) cells, and dendritic cells (DCs). The data represent probe set signal intensities in linear scale. Error bars indicate standard errors. (B) Visualization of the abundance of hsa-miR-548ac molecules in 7 different blood cell types. Relative expression is displayed by z-scores as calculated from FANTOM5 deep sequencing data [36]. The miRNA was preferentially found in CD8+ T-cells and NK cells, whereas much lower levels were noted in B-cells and myeloid DCs. This expression pattern partially reflects the expression of the host gene CD58. Divergences might be explained by uncoupling of miRNA production from the transcription of the shared primary RNA.

