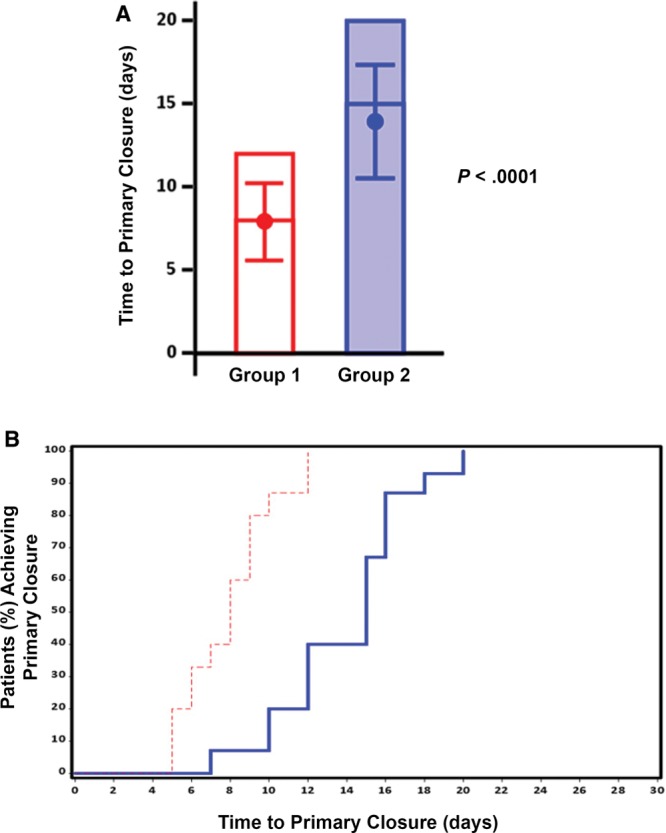
Fig. 4.

Effect of NPWTi-d and ciNPT on time to primary closure. A, Bar graph indicating the maximum number of days before sternal wound closure. The mean (± SD) and the median time to primary closure are represented by the dot inside the bar and the horizontal line inside the bar, respectively. B, Kaplan–Meier curve showing the time to primary closure for the percentage of patients in group 1 (red dashed line) and group 2 (solid blue line).
