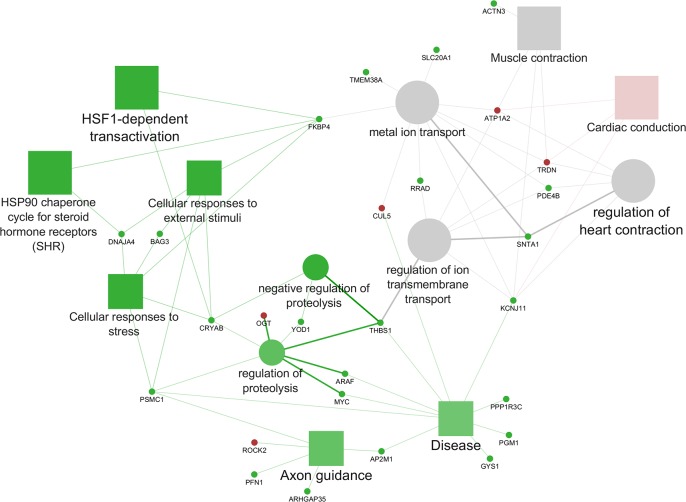
Fig 5. Cytoscape functional analysis of LES vs LPE comparison displaying hub DEGs.
Significant GO terms are graphically summarized using REVIGO. squares = pathways; circles = biological processes; shape size = according to the P-value of the term in its own group; red colour = up-regulated (cluster #1); green colour = down-regulated (cluster #2); grey colour = same number of up- and down-regulated genes (None specific cluster); fill colour transparency = according to the percentage of genes belonging to the term, lighter colour corresponds to a lower percentage while darker colour to a higher percentage; font size = according to the P-value of the term in its own group; interaction line thickness = according to Kappa Score value, represents the strength of the interactions, lighter colour corresponds to a lower strength while darker colour to a higher strength.

