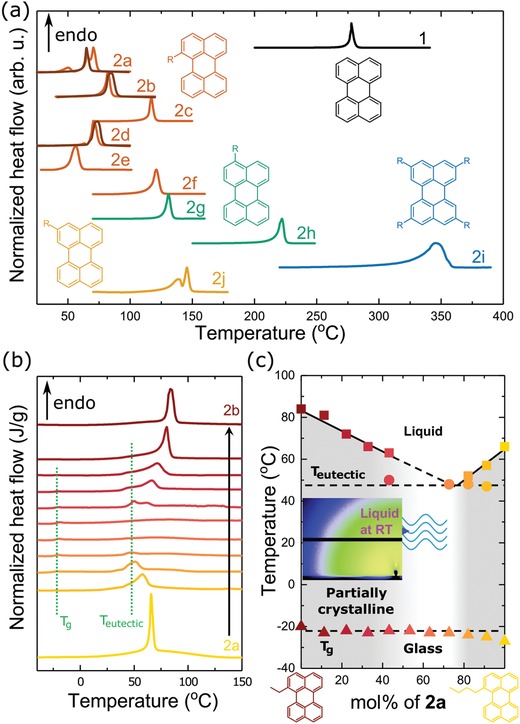
Figure 4.

a) Differential scanning calorimetry (DSC) thermograms of 1 and 2a‐j representing the initial heating half‐cycle of as‐synthesized powder and of material solidified from DCM (kept at −50 °C for 30 min before the scan; darker lines). The heat flow is normalized to the peak height of each melting endothermic transition. The insets show molecular structures with substituent positions. b) DSC thermograms representing the initial heating half‐cycle for blends of 2a and 2b solidified from DCM (kept at −50 °C for 30 min prior to the first heating scan). Glass transition (T g) and eutectic transition (T eutectic) temperatures are marked by vertical dotted lines. c) Phase diagram of mixtures of 2a and 2b. The liquidus (solid lines) are sketched following the peak melting temperature (squares) of each blend. The glass transition and eutectic transition (dashed lines) are sketched following the enthalpy relaxation peak associated with the glass transition (triangles) and the peak temperature for the eutectic point (circles), respectively. The lightly gray area indicates the region where the blend remains liquid. The gray area indicates the region where the blend is partially crystalline and the remaining area indicates the region where the blend is a liquid or a glass. The inset shows a grazing‐incidence wide angle X‐ray scattering (GIWAXS) diffractogram of a 1:1 molar ratio blend of 2a and 2b kept at room temperature for 1 month.
