
Figure 3.
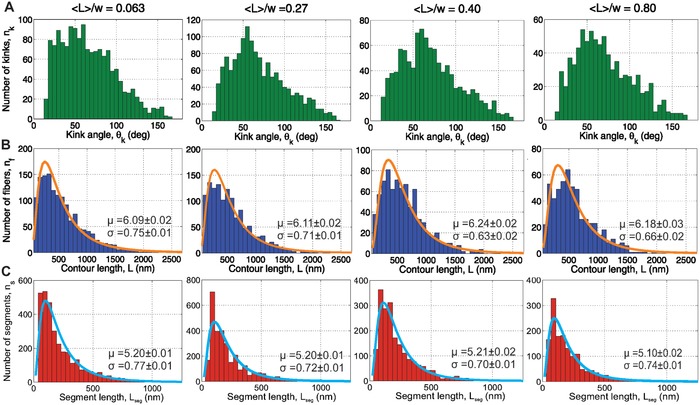
Full statistics distributions. In all distributions the number of counted fibrils for the different confinements are: 0.063–1420, 0.27–1286, 0.40–791, and 0.80–562. A) Kink angle distributions; B) fibril contour length distributions with lognormal fit (μ and σ fit parameters given on the plot). C) Segment length distributions with lognormal fit (μ and σ fit parameters given on the plot).