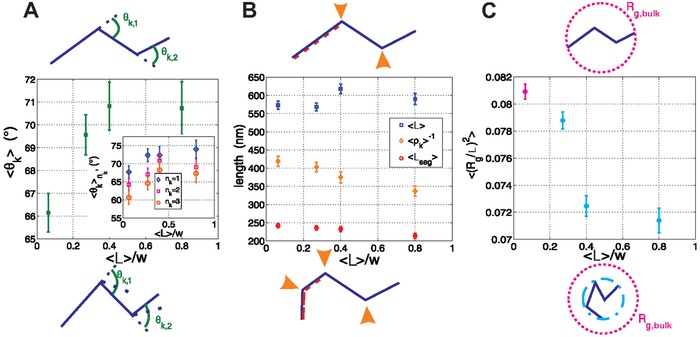
Figure 4.

Fibril conformations in slits. Schematics at the top represent fibril parameters for the unconfined case, whereas those at the bottom represent the same parameters in the confined cases. A) Overall mean kink angle, 〈θk〉, as a function of 〈L〉/w, with subplot of the mean kink angle per kink population, as a function of 〈L〉/w. B) Mean contour length 〈L〉 (blue squares), mean inverse kink density 〈ρk〉−1 (green diamonds), and mean segment length 〈L seg〉 (red circles) as a function of 〈L〉/w. C) normalized mean square radius of gyration 〈(R g/L)2〉 as a function of 〈L〉/w.
