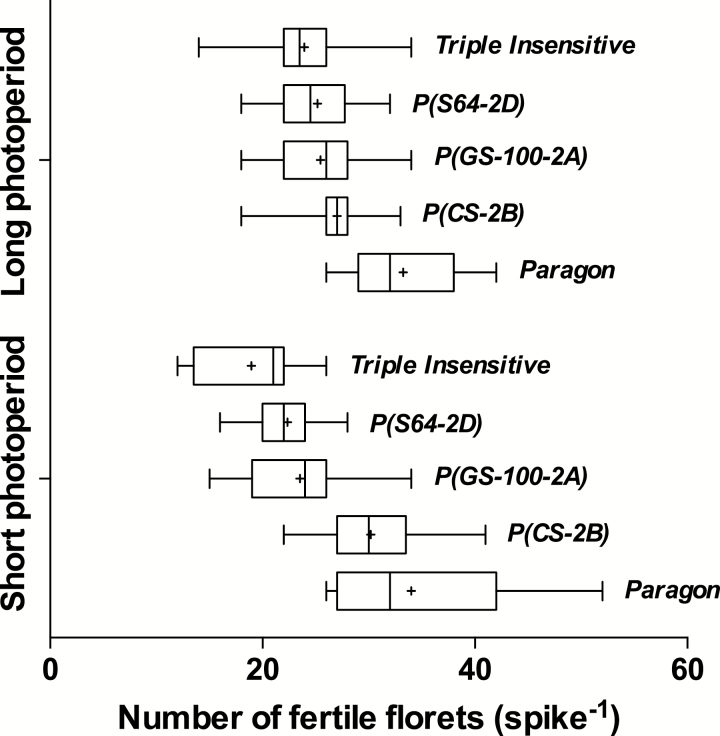
Fig. 1.
Box-and-whiskers plot for number of fertile florets per spike produced by each genotype under either a long (16-h) or short (12-h) photoperiod. The boxes consist of the 25th to 75th percentiles, with the mean indicated by ‘+’ and the median indicated by the vertical line. The whiskers extend from the minimum to the maximum.

