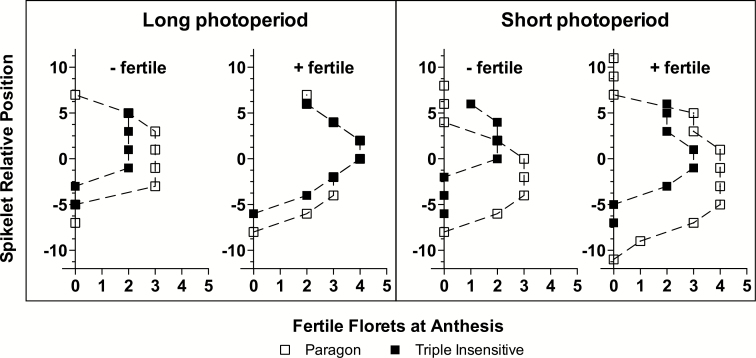
Fig. 2.
Fertility profiles of most and least fertile spikes (‘+ fertile’ and ‘- fertile’, respectively) for the Paragon and Triple Insensitive genotypes under long (16-h) and short (12-h) photoperiods. The graphs show the number of fertile florets at anthesis for a given spikelet position for one half of the spike, with zero on the y-axis representing the central spikelet of the spike.

