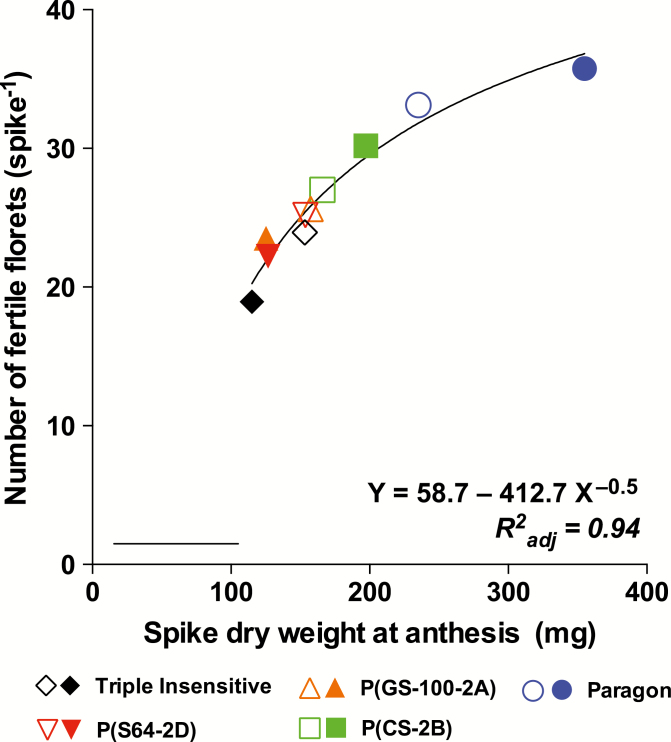
Fig. 3.
Relationship between the number of fertile florets per spike and the spike dry weight at anthesis for the different genotypes. Open and closed symbols refer to long (16-h) and short (12-h) photoperiods, respectively. The horizontal bar indicates the minimum significant difference for Tukey’s test (α=0.05). (This figure is available in colour at JXB online.)

