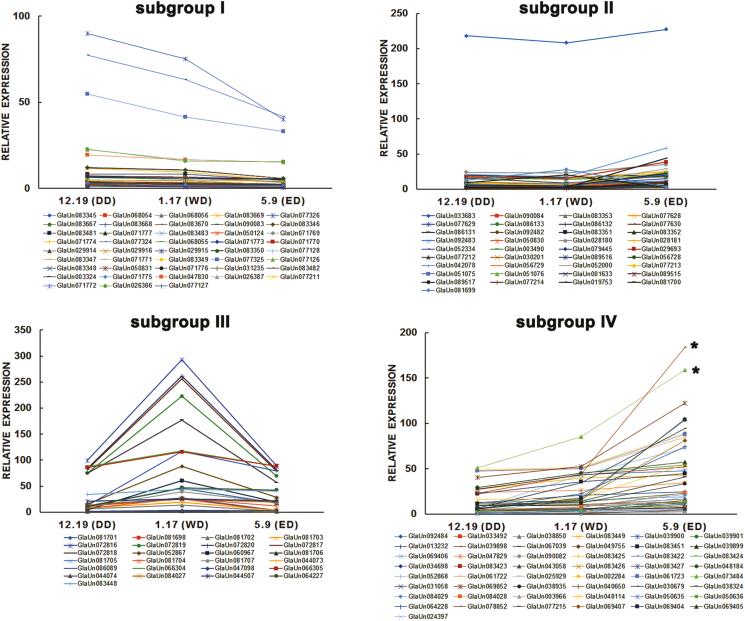
Fig. 3.
Expression patterns of GhPP2C genes in Gladiolus CDR. An asterisk (*) represents the selected unigenes (GhPP2C1) from Gladiolus CDR transcriptome analysis. Expression of unigenes in the top left panel decreased during CDR (DD→WD→ED). Unigenes in the top right panel decreased in expression from DD to WD, but increased from WD to ED. Expression of unigenes in the bottom left panel increased from DD to WD, but decreased from WD to ED. Expression of unigenes in the bottom right panel increased during CDR (DD→WD→ED). The expression levels are based on a FPKM evaluation. DD, deep dormancy; WD, weak dormancy; ED, ecodormancy. (This figure is available in color at JXB online.)

