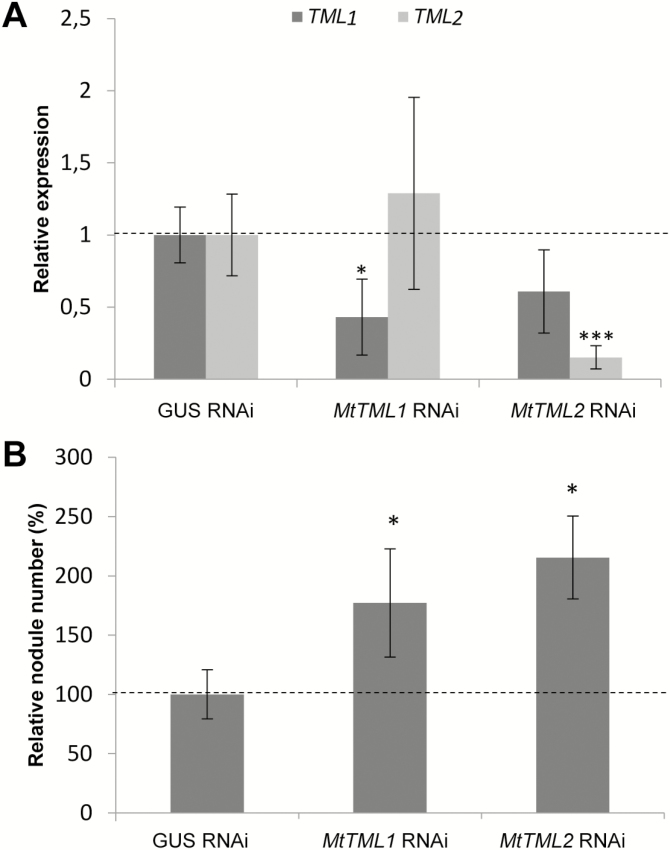
Fig. 7.
Increased nodule number in M. truncatula roots silenced for MtTML1 and MtTML2. (A) Expression analysis of MtTML1 and MtTML2 genes in MtTML1 and MtTML2 RNAi roots. Gene expression was calibrated relative to GUS RNAi control roots to highlight fold changes, as indicated by the dotted line. Error bars represent the SD (n=4 per biological replicate). *P<0.05; **P<0.01; ***P<0.001, significant differences from the levels observed in the 35S:GUS RNAi genotype as found with an ANOVA mixed model with a post-hoc Tukey comparison. (B) Nodule number per plant in GUS RNAi (control), MtTML1 RNAi, or MtTML2 RNAi roots at 14 dpi with S. meliloti. Data from two independent biological experiments were normalized relative to the control. Error bars represent confidence intervals (α=0.05; n>13 plants per biological replicate). Significant statistical differences are indicated by asterisks based on a Kruskal–Wallis test (α<0.05).

