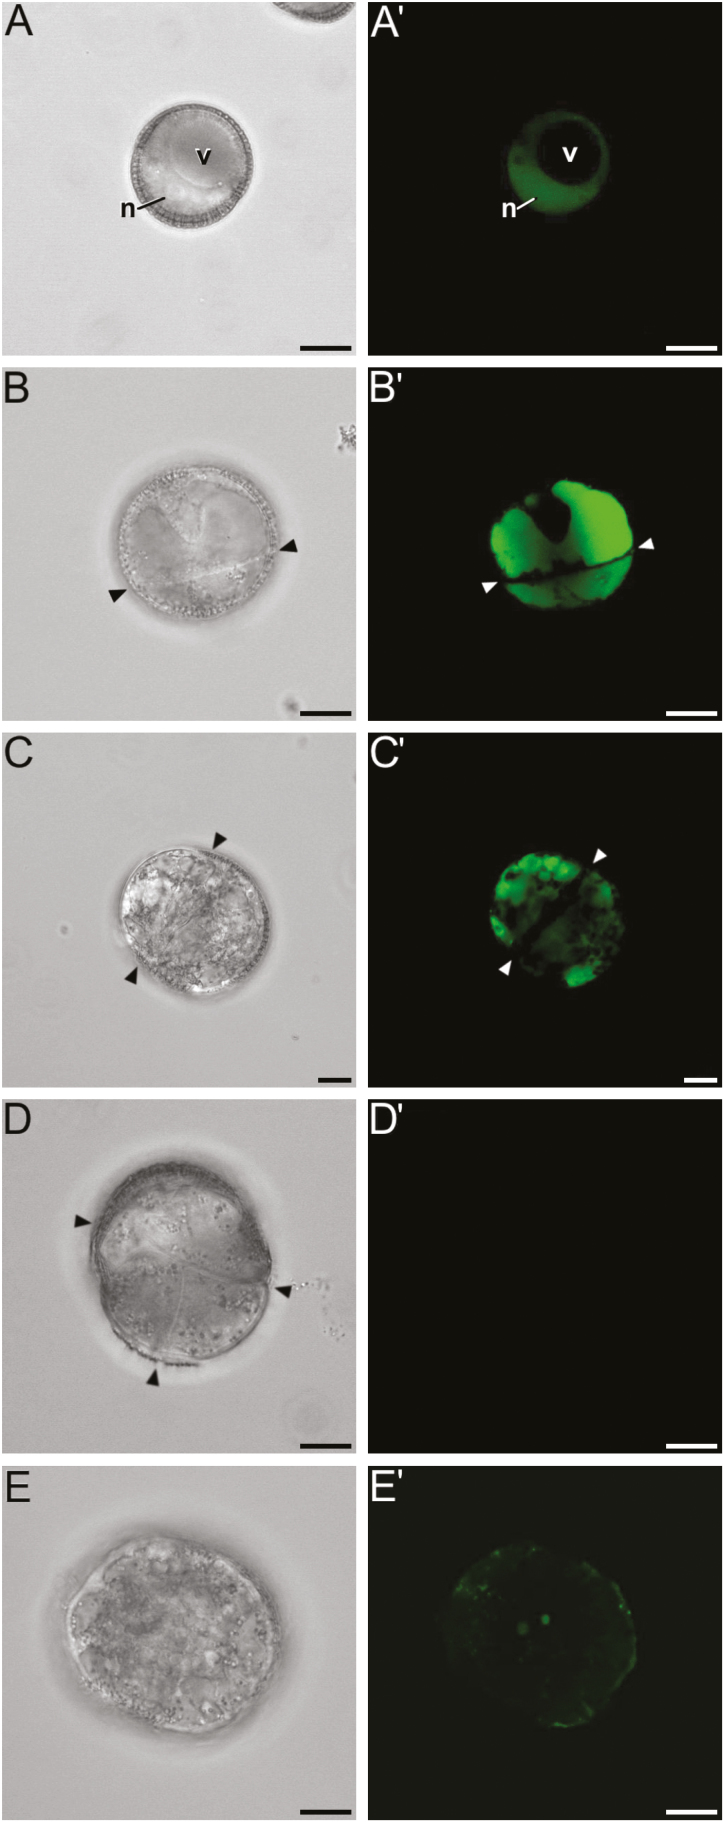
Fig. 4.
Dynamics of Ca2+ in cultured microspores of rapeseed line DH4079. Phase contrast (A–F) and FluoForte fluorescent staining (A′–F′) pairs of images are shown. (A, A′) Freshly isolated microspore showing a nuclear–cytosolic Ca2+ signal. (B, B′) Newly divided embryogenic microspore with an intense nuclear–cytosolic and vacuolar Ca2+ signal. The arrowheads indicate inner cell walls. (C, C′) Embryogenic structure with a Ca2+ signal that is principally vacuolar and is reduced in the nucleus/cytosol. (D, D′) Multicellular embryogenic structure with almost no detectable Ca2+ signal. (E, E′) Pollen-like structure with a faint, punctate Ca2+ signal that is mostly peripheral and at the centrally located sperm-like nuclei. N, nucleus; v, vacuole. Scale bars are 10 μm.

