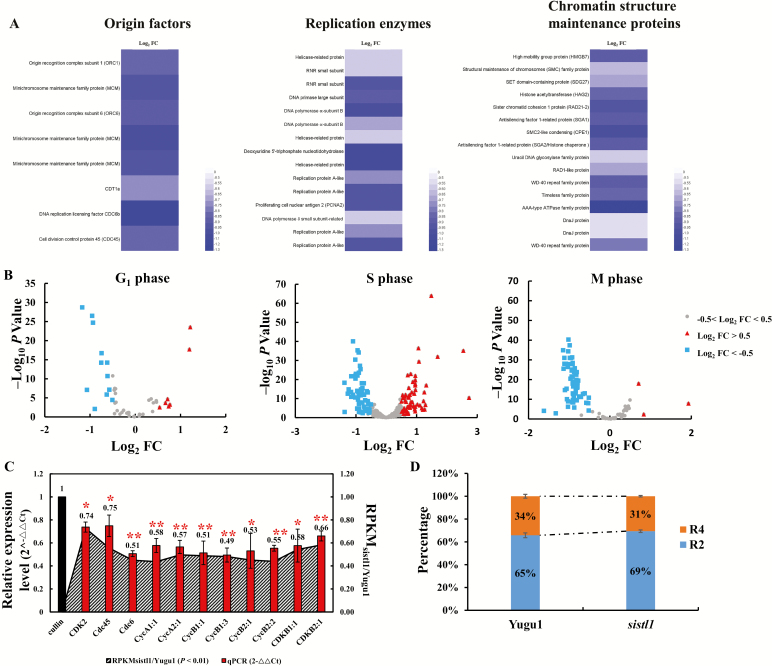
Fig. 8.
RNA-seq and flow cytometric analysis of Yugu1 and sistl1. (A) Heatmaps of genes encoding DNA replication origin factors, replication enzymes or chromosome structural maintenance proteins that significantly reduced gene expression abundances in sistl1 (log2FC<−0.5 and P<0.01, log2FC=log2RPKMsistl1/Yugu1. RPKM, reads per kilobase of transcript per million fragments mapped). (B) Expression changes of 49, 324 and 107 genes that were preferentially expressed during G1, S, and M phase, respectively, between sistl1 and Yugu1 within the RNA-seq analysis. The x-axis is log2FC, indicating log2RPKMsistl1/Yugu1 of the discussed genes, and the y-axis is −log10P. The triangles indicate genes where log2FC>0.5 and −log10P>2, which means that the expression level of these genes in sistl1 was >1.41 times higher than that in Yugu1. The squares indicate genes where log2FC<−0.5 and −log10P>2, which means that the expression level of these genes in sistl1 was >1.41 times down-regulated in Yugu1. The gray circles represent genes where −0.5<log2FC<0.5, which means that the expression level of these genes in sistl1 had no significant difference compared with that of in Yugu1. Detailed information, such as gene ID, log2FC, P-value and preferential expression phase of the genes shown in the figure is listed in Supplementary Table S8. (C) Relative expression levels of 11 representative cell cycle regulatory genes in sistl1. Left y-axis shows the 2−ΔΔCt values for these genes with a qRT-PCR assay (with Cullin as the reference gene). Right y-axis shows the RPKMsistl1/Yugu1 values for these genes extracted from RNA-seq. Asterisks indicate a significant difference between the relative expression level of genes in Yugu1 and sistl1; error bars, ±SD (n=3 replicates), Student’s t-test, **P<0.01; *P<0.05. (D) Results of flow cytometric analysis of 3-day-old first-leaf cells. R4 indicate 4C cells, and R2 indicate 2C cells.

