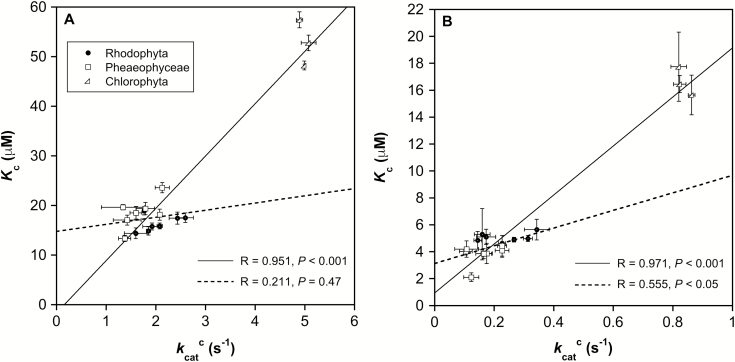
Fig. 2.
Trade-off between the maximum carboxylation rate (kcatc) and the Michaelis–Menten affinity constant for CO2 (Kc) for the analyzed seaweed Rubiscos at (A) 25 °C and (B) 4 ° C. The solid line represents the correlation of all populations together (including chlorophytes); the dashed line represents the correlation of form ID Rubiscos alone. Data are presented as mean ±SD (n=3–5).

