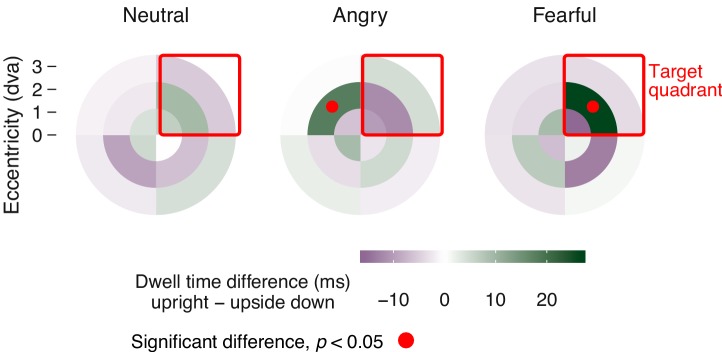
Figure 4. Spatial distribution of mean dwell time differences.
Differences in dwell time between upright and upside down presented faces across the stimulus field, divided into four quadrants and three eccentricities. Data were aligned such that the target position is in the upper right quadrant (red square). Dwell time differences show an orienting towards the position of upright fearful faces (upright 62.82 ± 10.80 ms SEM, upside down 36.37 ± 6.45 ms; red dots: p < 0.05, corrected for multiple comparisons), and an aversion of gaze away from the position of upright angry faces (upright 51.57 ± 8.72 ms; upside down 33.62 ± 4.36 ms), both compared to upside-down presented faces of the same emotion.

