. 2019 Feb 11;8:e43938. doi: 10.7554/eLife.43938

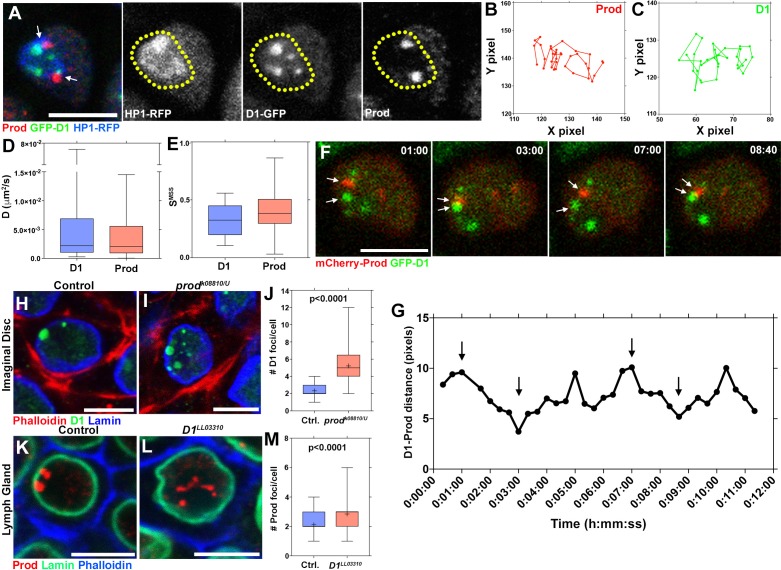
Figure 4. Dynamic association between D1 and Prod mediates the formation of chromocenters.

(A) Drosophila lymph cells expressing D1-GFP (green) and HP1-RFP (blue) stained with Prod (red). Arrows indicate juxtaposed Prod and D1 foci. Yellow line demarcates the heterochromatic domain based on HP1 localization. Scale bar: 5 μm. (B, C) Particle tracking analysis of single Prod (B) or D1 (C) foci in the XY plane. (D, E) Box-and-whisker plot of the diffusion co-efficients (D) and the slope of momentum scaling spectrum (E) of D1 (n = 25) and Prod (n = 29). (F) Time-lapse imaging of spermatogonia expressing nos-gal4 driven UAS-mCherry-Prod (red) and D1-GFP (green). Arrows indicate Prod and D1 foci coming together in a ‘kiss-and-run’ manner. Time is indicated in mm:ss. (G) Quantification of the distance between the D1 and Prod foci indicated in panel F over time. Arrows indicate the time points shown in panel F. (H, I) Heterozygous control (H) and prodk08810/U mutant (I) larval imaginal disc cells stained with Phalloidin (red), D1 (green), and Lamin (blue). (J) Box-and-whisker plot of the number of D1 foci per larval imaginal disc cell (control n = 72, prodk08810/U n = 65). (K, L) Heterozygous control (K) and D1LL03310 mutant (L) larval lymph gland cells stained with Prod (red), Lamin (green), and Phalloidin (blue). (M) Box-and-whisker plot of the number of Prod foci per larval lymph gland cell (control n = 63, D1LL03310 n = 66). All P values are from student’s t-test. All middle bars: median. All crosshairs: mean. All scale bars: 5 μm.

Figure 4—source data 1. Numerical data of particle tracking for Prod foci (corresponding to Figure 4B).
DOI: 10.7554/eLife.43938.016
Figure 4—source data 2. Numerical data of particle tracking for D1 foci (corresponding to Figure 4C).
DOI: 10.7554/eLife.43938.017
Figure 4—source data 3. Diffusion co-efficients of D1 and Prod (corresponding to Figure 4D).
DOI: 10.7554/eLife.43938.018
Figure 4—source data 4. Slope of momentum scaling spectrum of D1 and Prod (corresponding to Figure 4E).
DOI: 10.7554/eLife.43938.019
Figure 4—source data 5. Measurements of D1-Prod distance (corresponding to Figure 4G).
DOI: 10.7554/eLife.43938.020
Figure 4—source data 6. Number of D1 foci/cell in control vs prod mutant imaginal discs (corresponding to Figure 4J).
DOI: 10.7554/eLife.43938.021
Figure 4—source data 7. Number of Prod foci/cell in control vs D1 mutant lymph glands (corresponding to Figure 4M).
DOI: 10.7554/eLife.43938.022

Figure 4.

Figure 4—figure supplement 1. Co-immunoprecipitation experiments from multiple tissue lysates did not detect an interaction between Prod and D1.
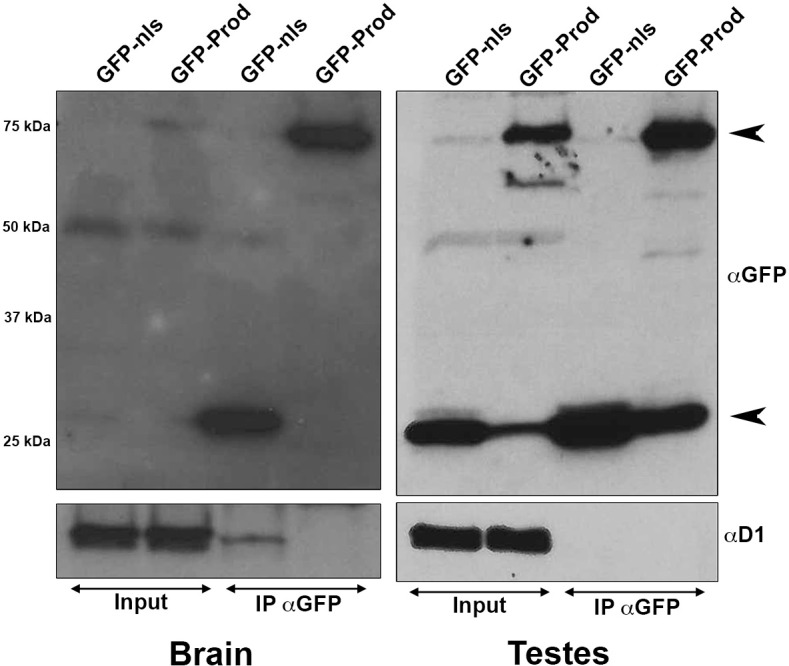
Figure 4—figure supplement 1.

(Left) Immunoprecipitation of GFP using GFP-Trap magnetic beads from larval brains expressing UAS-GFP-nls or UAS-GFP-Prod under the control of wor-gal4. (Right) Immunoprecipitation of GFP using GFP-Trap magnetic beads from Upd testis tumors expressing either UAS-GFP or UAS-GFP-Prod under the control of nos-gal4. Immunoprecipitated proteins were blotted using rabbit anti-GFP and guinea pig anti-D1. Expected sizes: GFP: 27 kDa, GFP-Prod: 75 kDa.
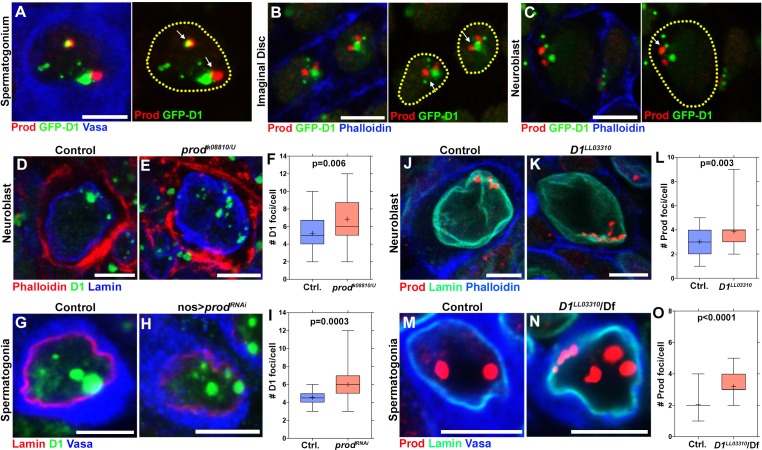
Figure 4—figure supplement 2. Mutually dependent clustering of D1 and Prod in multiple cell types.

Figure 4—figure supplement 2.

(A) Drosophila spermatogonia expressing D1-GFP (green) and stained for Prod (red) and Vasa (blue). Arrows indicate D1 and Prod foci in close proximity to each other. (B, C) Larval imaginal disc cells (B) and neuroblasts (C) expressing D1-GFP (green) and stained for Prod (red) and Phalloidin (blue). Arrows indicate D1 and Prod foci in close proximity to each other. (D, E) Heterozygous control (D) and prodk08810/U mutant (E) larval neuroblasts stained with Phalloidin (red), D1 (green), and Lamin (blue). (F) Box-and-whisker plot of the number of D1 foci per neuroblast (control n = 32, prodk08810/U n = 32). (G, H) Control (nos-gal4/+; UAS-dcr-2/+) (G) and prod-depleted (nos-gal4/UAS-prodRNAi; UAS-dcr-2/+) (H) spermatogonia stained with Lamin (red), D1 (green), and Vasa (blue). (I) Box-and-whisker plot of the number of D1 foci per spermatogonial cell (control n = 30, nos-gal4 >UAS prodRNAi n = 30). (J, K) Heterozygous control (J) and D1LL03310 mutant (K) larval neuroblasts stained with Prod (red), Lamin (green) and Phalloidin (blue). (L) Box-and-whisker plot of the number of Prod foci per neuroblast (control n = 45, D1LL03310 n = 40). (M, N) Heterozygous control (M) and D1LL03310 mutant (N) spermatogonia stained with Prod (red), Lamin (green), and Vasa (blue). (O) Box-and-whisker plot of the number of Prod foci per spermatogonial cell (control n = 75, D1LL03310 n = 75). All P values are from student’s t-test. All crosshairs: mean. All scale bars: 5 μm.
Figure 4—figure supplement 2—source data 1. Number of D1 foci/cell in control vs prod mutant neuroblasts (corresponding to Figure 4—figure supplement 2F).
DOI: 10.7554/eLife.43938.025
Figure 4—figure supplement 2—source data 2. Number of D1 foci/cell in control vs prod RNAi spermatogonia (corresponding to Figure 4—figure supplement 2I).
DOI: 10.7554/eLife.43938.026
Figure 4—figure supplement 2—source data 3. Number of Prod foci/cell in control vs D1 mutant neuroblasts (corresponding to Figure 4—figure supplement 2L).
DOI: 10.7554/eLife.43938.027
Figure 4—figure supplement 2—source data 4. Number of Prod foci/cell in control vs D1 mutant spermatogonia (corresponding Figure 4—figure supplement 2O).
DOI: 10.7554/eLife.43938.028
Figure 4—figure supplement 3. Mutually dependent clustering of the {AATAT}n and {AATAACATAG}n in multiple cell types.

Figure 4—figure supplement 3.

(A, B) FISH was performed against the {AATAT}n satellite DNA (red) in heterozygous control (A) and prodk08810/U mutant (B) larval imaginal discs stained with D1 (green), and Lamin (blue). (C, D) Box-and-whisker plots of the number of {AATAT}n foci per cell in imaginal discs (C, control n = 42, prodk08810/U n = 36) and lymph glands (D, control n = 41, prodk08810/U n = 36). (E, F) FISH was performed against the {AATAACATAG}n satellite DNA (red) in heterozygous control (E) and D1LL03310 mutant (F) larval lymph glands stained with Prod (green), and Lamin (blue). (G, H) Box-and-whisker plots of the number of {AATAACATAG}n foci per cell in imaginal discs (G, control n = 53, D1LL03310 n = 46) and lymph glands (H, control n = 46, D1LL03310 n = 37). All P values are from student’s t-test. All crosshairs: mean. All scale bars: 5 μm.
Figure 4—figure supplement 3—source data 1. Number of AATAACATAG foci/cell in control vs D1 mutant imaginal discs (corresponding to Figure 4—figure supplement 3G).
DOI: 10.7554/eLife.43938.030
Figure 4—figure supplement 3—source data 2. Number of AATAACATAG foci/cell in control vs D1 mutant lymph gland (corresponding to Figure 4—figure supplement 3H).
DOI: 10.7554/eLife.43938.031