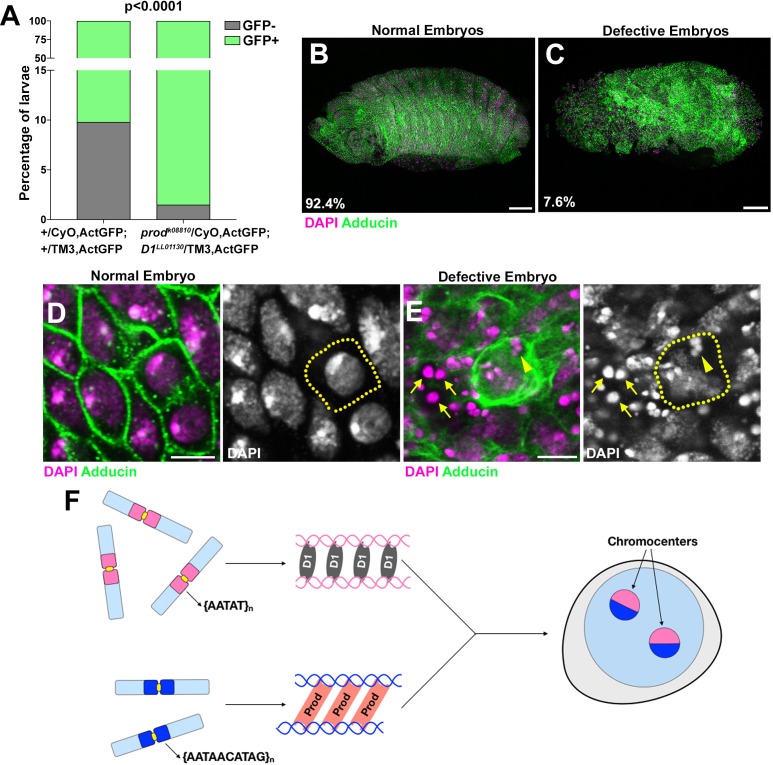
Figure 5. D1 prod double mutation leads to embryonic lethality.
(A) Quantification of GFP-positive and GFP-negative first instar larvae sired by +/CyO, ActGFP; +/TM3, ActGFP and prodk08810/CyO, ActGFP; D1LL03310/TM3, ActGFP adults. GFP-negative larvae from +/CyO, ActGFP; +/TM3, ActGFP parents are wild type while GFP-negative larvae from prodk08810/CyO, ActGFP; D1LL03310/TM3, ActGFP parents are double mutants. P value from student’s t-test is shown. (B, C) Normal (B) and defective (C) embryos from prodk08810/CyO, ActGFP; D1LL03310/TM3, ActGFP are stained with DAPI (red) and Adducin (green). Percentage of normal and defective embryos are indicated from n = 132. Scale bars: 25 μm. (D, E) Close-up view of normal (D) and defective (E) embryos from (B, C). Yellow line indicates cell boundary based on adducin staining. Arrows indicate extra-nuclear DNA and the arrowhead indicates micronuclei. Scale bar: 5 μm. (F) A model depicting the modular architecture of chromocenters in Drosophila melanogaster. Modules of D1-{AATAT}n and Prod-{AATAACATAG}n associate dynamically to bundle the entire chromosome complement into chromocenters.

