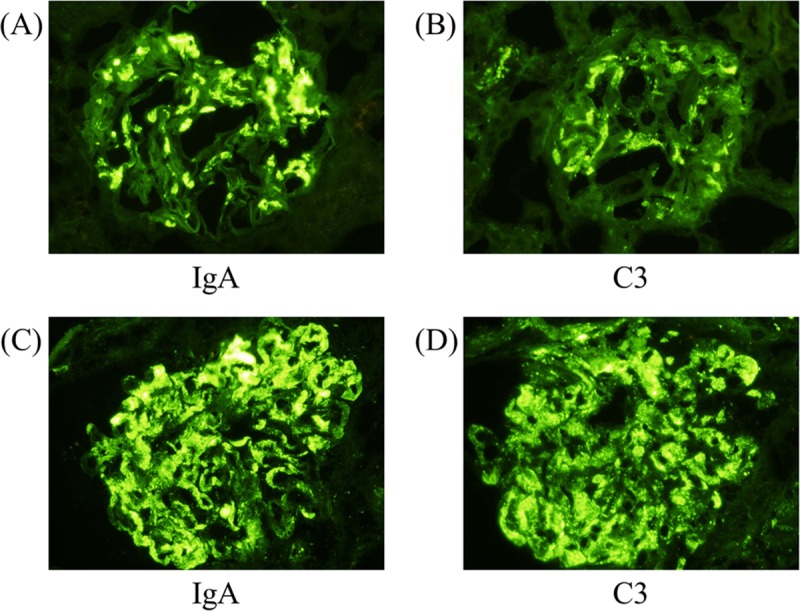
Fig 1. Representative immunofluorescence patterns of IgA and C3.

(A) IgA deposition and (B) C3 deposition in mesangial areas in a typical IgA nephropathy case. (C) IgA deposition and (D) C3 deposition in both mesangial and capillary areas in an atypical IgA nephropathy case. All magnifications of photos are x400.
