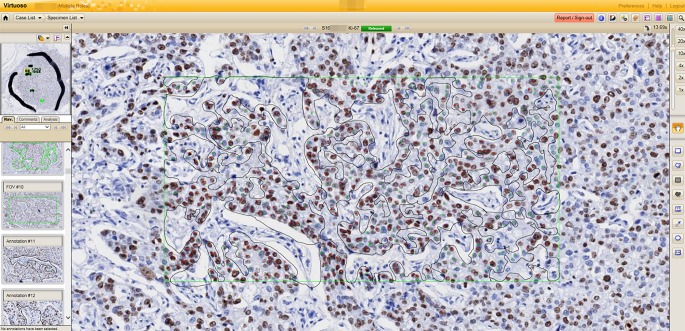
Fig 1. Automated digital image analysis by Ventana Virtuoso image analysis software.
Each slide is scanned and several areas are selected. A green line surrounds the selected area, and a black line excluded area. The selected areas are analyzed automatically, marking stained tumor cells with red dots and non-stained tumor cells with green dots. The non-tumor cells are excluded in analysis automatically.

