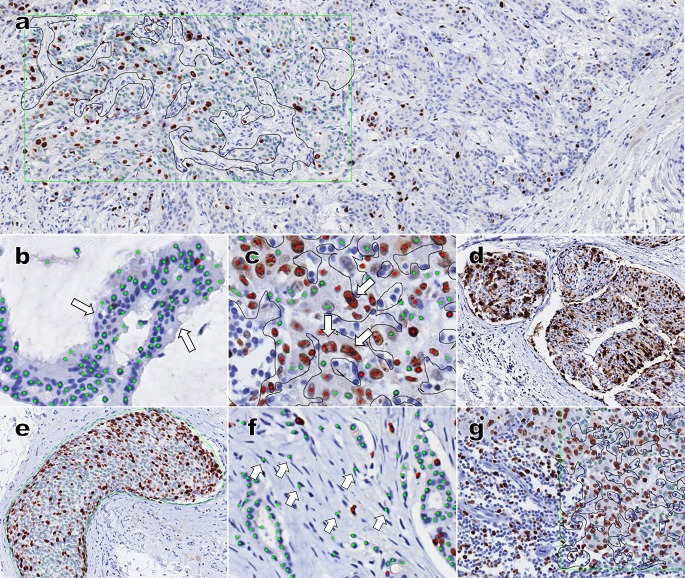
Fig 2. The causes of discrepancy between two visual assessment and automated data image analysis.
(a) Heterogeneity of Ki-67 immunostaining. The left side green-lined box had a higher Ki-67 labeling index (LI) than the right side, indicating a difference between visual assessment and automated digital image analysis. (b—c) Misidentification of tumor cells. (b) Some tumor cells (arrow) were not recognized due to limitation of the automated algorithm. (c) Pleomorphic large cells or dumbbell-shaped tumor cells were estimated as two or more cells. (d—e) Poor Ki-67 immunostaining quality. (d) Poor tissue fixation led to poor Ki-67 staining quality and interfered with automatic image analysis. (e) Changing the tissue block and re-staining for Ki-67 led to clear staining and image analysis. (f—g) Erroneous recognition of non-tumor cells as Ki-67-negative tumor cells. (f) Some stromal cells were assessed as Ki-67-negative tumor cells. (g) Areas with stromal cells and/or inflammatory cells should be excluded; tumor cells were selected (black line) to exclude non-tumor cells as much as possible.

