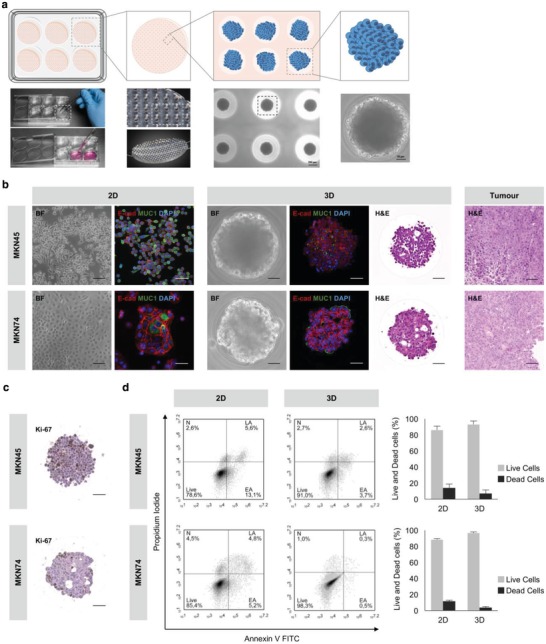
Figure 2.

3D culture of GC cells resembles the native GC histological subtype. a) Illustration of the 3D culture method. Agarose microwell arrays with 1000 conical microwells were placed in six‐well plates and 1 × 10⁶ GC cells were seeded on the top of each matrix. GC aggregates, formed by liquid overlay, were allowed to grow for 6 d under EV‐depleted medium. b) Representative images of the morphology (BF), expression of epithelial markers (E‐cad/MUC1) of 2D and 3D cultures, and histology (H&E) of 3D cultures and xenograft tumors of GC cells. Scale bars: 50 µm. BF: bright field; Ecad/MUC1: E‐cadherin/Mucin‐1; H&E: hematoxylin and eosin staining. Xenograft tumors were obtained from subcutaneous injection of 1 × 10⁶ MKN45 cells and 5 × 10⁶ MKN74 in athymic nude mice. c) Ki‐67 staining showing representative proliferative patterns in 3D cultures. Scale bars: 50 µm. d) Viability of cells harvested from 2D and 3D cultures (dissociated spheroids) tested by flow cytometry of annexin V and propidium iodide. Data representative of five independent experiments are shown. N: necrotic cells; LA: late apoptotic cells; EA: early apoptotic cells; Live: live cells.
