
Figure 4.
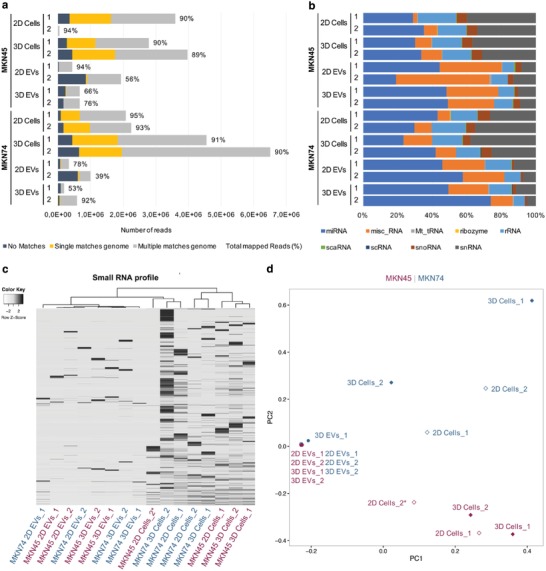
EVs released by GC cells under 2D and 3D conditions exhibit similar small RNA profiles. a) Total number of reads and percentage of mapped reads detected by small RNA sequencing. Reads that could not be mapped in the genome are shown in black; unique mappable reads are shown in dark gray; and reads that were mapped to multiple regions are shown in light gray. b) Distribution of mapped reads by small RNA classes. c) Heatmap and dendrogram of small RNA profiles of MKN45 and MKN74 EVs and cells in 2D and 3D cultures (Z‐score normalized expression values). d) Principal component analysis of small RNA profiles of MKN45 and MKN74 EVs and cells in 2D and 3D cultures. 1 and 2 represent two independent biological replicates. *Sample with reduced number of reads.