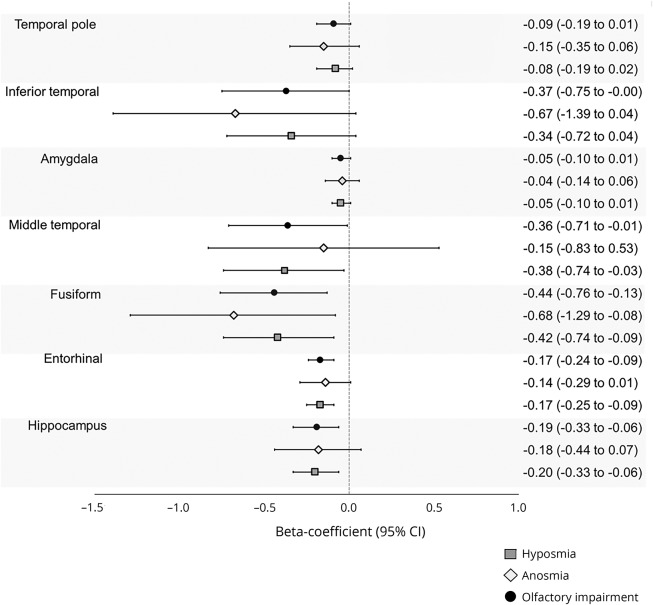
Figure 3. β Coefficients and 95% CIs of olfactory function in relation to regional brain volumes from linear regression (adjusted for age, sex, education, APOE ε4, baseline global cognition, and scanning site).
Olfaction categories were defined based on baseline Brief Smell Identification Test scores as follows: anosmia (score <6), hyposmia (6–10 men, women 6–10.25), and normal olfaction (10.25–12 men, women 10.5–12). Volumes are expressed as tenths of percentages of intracranial volume. CI = confidence interval.

