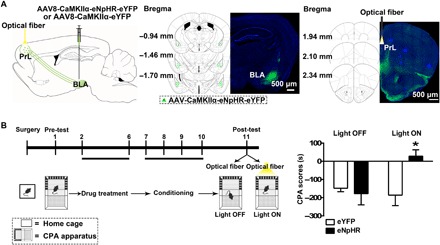
Fig. 2. Influence of the inhibition of BLA projection neurons to the PrL on CPA.

(A) Left: Diagram of virus injection site in the BLA and optical fiber implantation site in the PrL. Middle: Image of coronal brain slice showing the expression of eNpHR-eYFP (green-colored) 6 weeks after virus injection into the BLA. Numbers indicate coordinates relative to bregma. Scale bar, 500 μm. Right: Image of coronal brain slice showing strong eNpHR-eYFP–positive fibers (green-colored) in the PrL and the optical fiber tip (yellow-colored) in the PrL 6 weeks after virus injection into the BLA. Numbers indicate coordinates relative to bregma. Scale bar, 500 μm. (B) Left: Experimental timeline for the CPA procedure. Right: Average CPA score in eNpHR-eYFP– and eYFP-expressing mice in light OFF and light ON groups (n = 8 mice in each group; two-way ANOVA, *P < 0.05). Data are means ± SEM.
