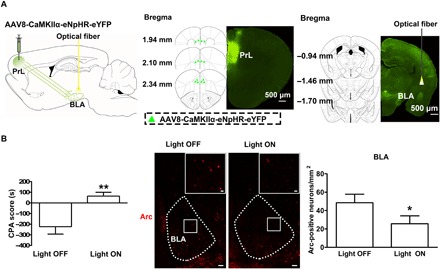
Fig. 6. Influence of in vivo optogenetic inhibition of glutamatergic inputs from the PrL to the BLA on conditioned context–induced increase in the expression of Arc in the BLA in morphine withdrawal mice.

(A) Left: Diagram of virus injection site in the PrL and optical fiber implantation site in the BLA. Middle: Image of coronal brain slice showing the expression of eNpHR-eYFP (green-colored) 6 weeks after virus injection into the PrL. Numbers indicate coordinates relative to bregma. Scale bar, 500 μm. Right: Image of coronal brain slice showing strong eNpHR-eYFP–positive fibers (green-colored) in the BLA and the optical fiber tip (yellow-colored) in the BLA 6 weeks after virus injection into the PrL. Numbers indicate coordinates relative to bregma. Scale bar, 500 μm. (B) Left: Average CPA score in eNpHR-eYFP mice in light OFF and light ON groups (n = 6 mice in each group; unpaired t test, **P < 0.01). Middle: Arc-positive neurons in the BLA in light OFF and light ON groups (red-colored). Scale bars, 100 μm. BLA regions enclosed by white boxes were shown in a higher magnification in upper right square images. Scale bars, 20 μm. Right: Average Arc-positive neurons/mm2 in the BLA in light OFF and light ON groups (n = 6 mice in each group; unpaired t test, *P < 0.05). Data are means ± SEM.
