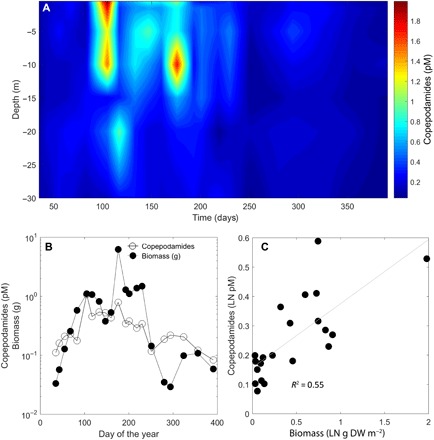
Fig. 3. In situ measurements of copepodamides.

(A) Depth-resolved concentration of copepodamides over a temperate year off the Swedish west coast. Samples were taken biweekly at depths of 0, 1, 5, 10, 15, 20, and 30 m. Color scale shows the concentration (pM) of total copepodamides. (B) Average concentration of copepodamides (pM) in the water column in relation to copepod biomass (g DW m−2) over the year. (C) Copepodamide concentration largely follows the biomass of copepods, which is more evident if the natural logarithm of copepodamide concentration (pM) is plotted against the natural logarithm of the copepod biomass (g DW m−2).
