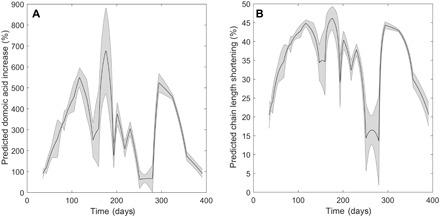
Fig. 4. Predicted effects of copepodamides in nature.

(A) Predicted domoic acid production increase (%) over the year calculated from in situ concentrations of copepodamides in the upper 15 m (Fig. 2) and dose-response relationships (Fig. 3). The shaded error interval represents the SD. (B) Predicted decrease in chain length for S. marinoi calculated the same way. The different shape of the curve in (B) is due to the more sensitive S. marinoi more often approaching the maximum level of induction (here 50%).
