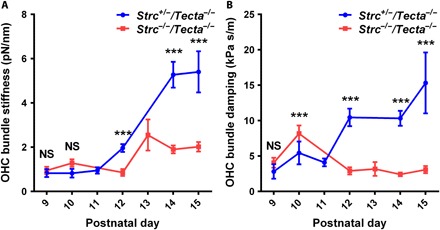
Fig. 6. Developmental changes in apical turn OHC stereociliary bundle stiffness and damping from P9 to P15.

Apical turn OHC bundle stiffness (A) and bundle damping (B) in control Strc+/−/Tecta−/− mice and Strc−/−/Tecta−/− mice lacking horizontal top connectors. At P9 and P10, the bundle stiffness values show no significant differences, whereas the viscous damping shows significant difference at P10. From P12 onward, bundle stiffness and damping markedly increase in Strc+/−/Tecta−/− OHCs. Data are presented as means ± SEM; *** indicates significant differences, P < 0.05 (by unpaired two-tailed Student’s t test with Welch’s correction); NS indicates nonsignificant differences, P > 0.05 (by unpaired two-tailed Student’s t test with Welch’s correction); number of measurements pooled per postnatal day (animals, cells) for Strc+/−/Tecta−/− OHCs [P9 (2, 4), P10 (1, 4), P11 (1, 8), P12 (1, 8), P14 (4, 32), and P15 (2, 8)] and Strc−/−/Tecta−/− OHCs [P9 (1, 11), P10 (2, 16), P12 (1, 6), P13 (1, 6), P14 (3, 17), and P15 (3, 23)].
