Figure 3.

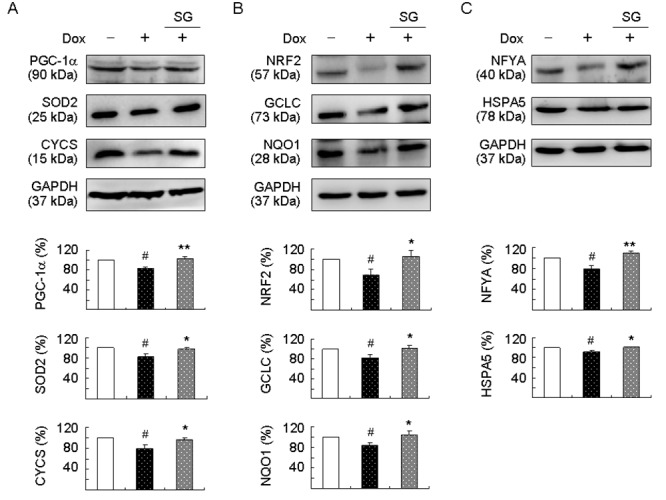
Enhanced expression of PGC-1α, NRF2, and NFYA pathways following SG-Tang administration on TBP/Q79-GFP-expressing SH-SY5Y cells. On day 2, differentiated SH-SY5Y cells were pretreated with 100 μg/ml SG-Tang for 8 h and TBP/Q79-GFP expression was induced for 6 days. Relative (A) PGC-1α, SOD2, and CYCS; (B) NRF2, GCLC, and NQO1; and (C) NFYA and HSPA5 protein levels were analysed by immunoblotting using specific antibodies. Levels of protein were normalized to GAPDH internal control (n = 3). Relative protein levels were shown below the representative Western blot images. To normalize, expression level in uninduced (without Dox) cells was set at 100%. P values: comparisons between induced and uninduced cells (#: P < 0.05), or between treated and untreated cells (*: P < 0.05 and **: P < 0.01).
