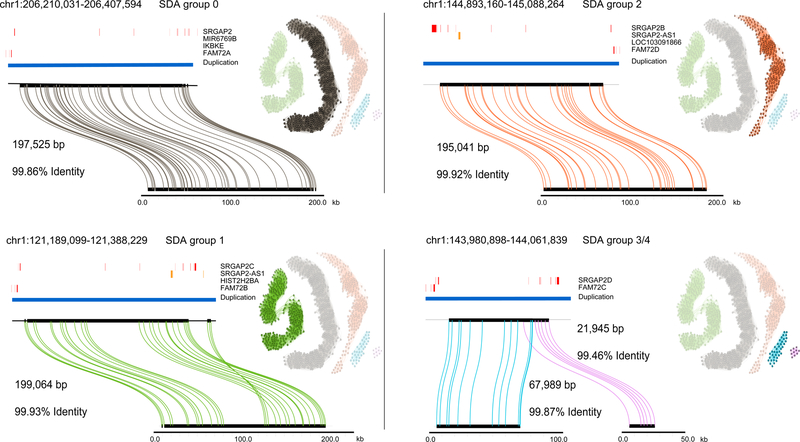
Figure 3. Sequence and assembly of SRGAP2 loci in the CHM13 human genome.
SDA sequence contigs from CHM13 aligned to the GRCh38 loci for SRGAP2(A/B/C/D) using Miropeats49. The length and percent identity of each alignment is shown. Similarly, in CHM1 we found that, on average, our sequence is 99.91% identical over all four loci and >99.999% identical if only mismatched bases are counted as errors as opposed to including indels. Adjacent to each alignment is the PSV graph with the relevant PSVs highlighted. Each node represents a PSV and loci are colored and numbered to reflect the grouping determined by correlation clustering. An edge is added between two nodes (PSVs) when a sequencing read contains both PSVs. The opacity of each node scales from 25% to 100% to reflect the position of the PSV along the collapse: 25% opacity reflects the first position along the collapse and 100% reflects the final position. For a more detailed view of the opacity of the nodes, see Figure S12. Clusters 3 and 4 in the PSV graph represent the fourth paralog (SRGAP2D), which carries a large deletion in the middle relative to the other paralogs.

