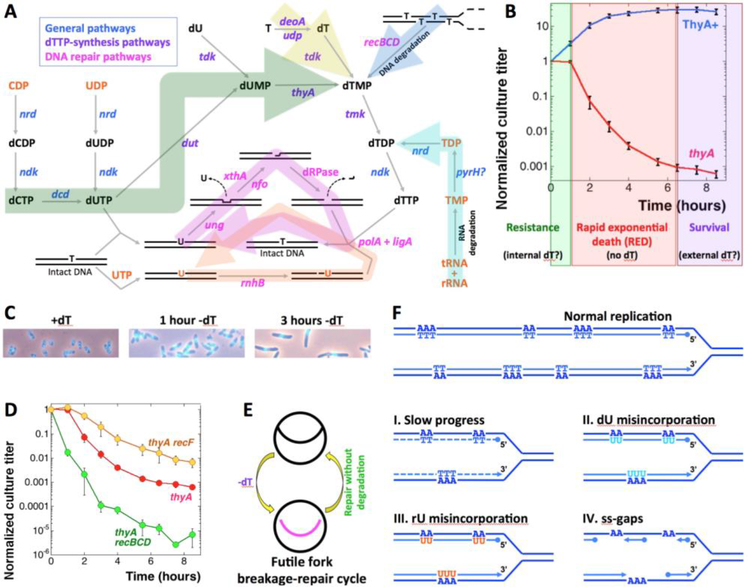
Fig. 1. The metabolism of dTTP production, the phenomenon of TLD, the futile cycles, and the expected changes in nucleotide metabolism mutants and kinetics of chromosomal fragmentation.
A. The metabolic pathways. Compounds of DNA metabolism are in black, compounds of RNA metabolism are in orange. Genes are colored according to functions: general (blue), dTTP-synthesis (purple) or DNA repair (magenta). The big arrow shades are: green, general biosynthesis; yellow, salvage; blue, DNA degradation; cyan, RNA degradation; magenta, futile DNA-dU misincorporation/excision cycle; orange, futile DNA-rU misincorporation/excision cycle. B. Extended time course of the culture titer during thymine starvation in our standard conditions, to highlight the survival phase. The strains are: ThyA+, KKW59; thyA, KKW58. The three phases of TLD are shown in color: green for the resistance phase, red for the RED phase, purple for the survival phase. The values in this and subsequent figures are means of 4–40 independent measurements ± SEM. C. DAPI-staining of cells grown in the presence of dT, as well as the same cells T-starved for 1 hour or for 3 hours. D. The thyA recBCD mutants lack the resistance phase, while the thyA recF mutants die slowly. The strains are: thyA, KKW58; thyA recBCD, KJK63; thyA recF, RA31. Here and henceforth: if error bars are not visible, they are masked by the symbols. E. A scheme of the futile fork-break-and-repair cycle. F. Various models of replisomes traversing A-runs in the template DNA during T-starvation that we tested in this work.

