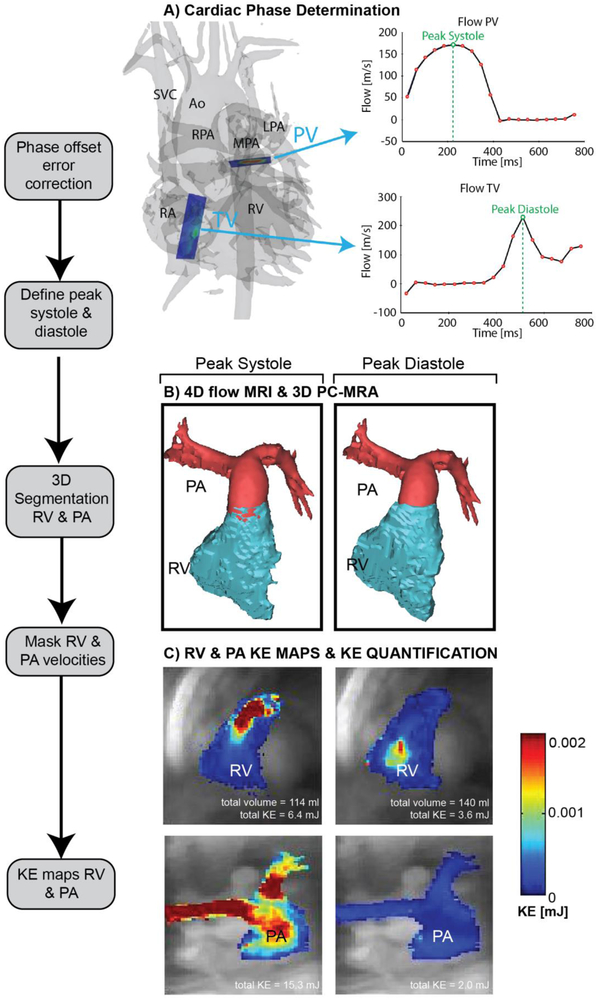
Fig. 1.
Four-dimensional (4-D) flow MRI data analysis. a Four-dimensional flow-derived 3-D phase-contrast MR angiogram and 2-D analysis planes at the level of the pulmonary valve (PV) and tricuspid valve (TV). The analysis planes were used to calculate flow–time curves to determine peak systole and diastole via peak flow rates. b Three-dimensional segmentations of the right ventricle (RV) and pulmonary artery (PA) based on the 3-D phase-contrast MR angiography data and masking of velocities inside the segmented vessels. Separate segmentations were generated for peak systole and peak diastol. c Calculation of RV and PA kinetic energy (KE) maps during systole and diastole. Total KE is listed below each map. Ao aorta, LPA left pulmonary artery, MPA main pulmonary artery, RA right atrium, RPA right pulmonary artery, SVC superior vena cava

