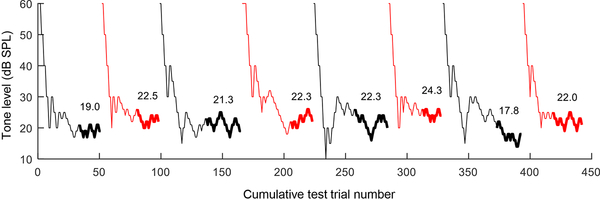
Fig. 1.
Representative behavioral results from two-down, one-up, adaptive tracking sessions in the budgerigar. Tone level is plotted as a function of cumulative test trial number across eight sessions. Results of successive sessions are drawn in different colors for clarity. Thick lines indicate the region of the track used to calculate threshold, which is indicated in dB SPL above the track. Data are from animal K6 in response to 80-ms tones with a frequency of 2 kHz.

