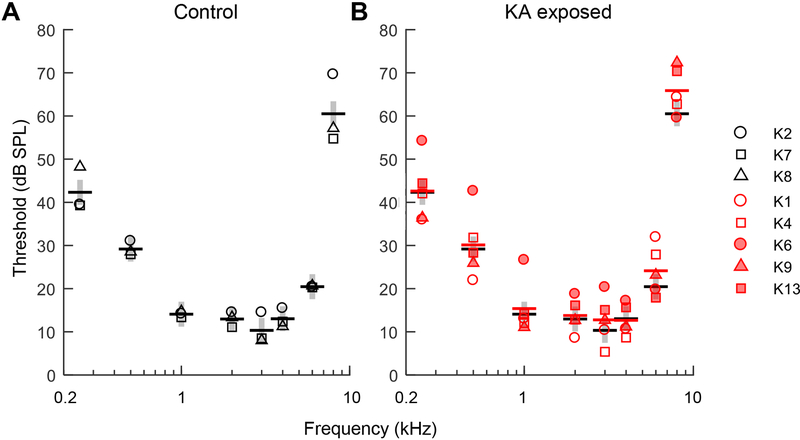
Fig. 5.
Behavioral audiograms plotting tone detection threshold as a function of frequency in three control animals (A) and five KA exposed animals (B). Stimulus duration was 0.3 s. Thick horizontal bars are mean thresholds of each group (control: black; KA exposed: red). Gray vertical bars indicate the average standard deviation of the control group across test frequencies. KA induced AN damage has no apparent impact on the behavioral audiogram.

