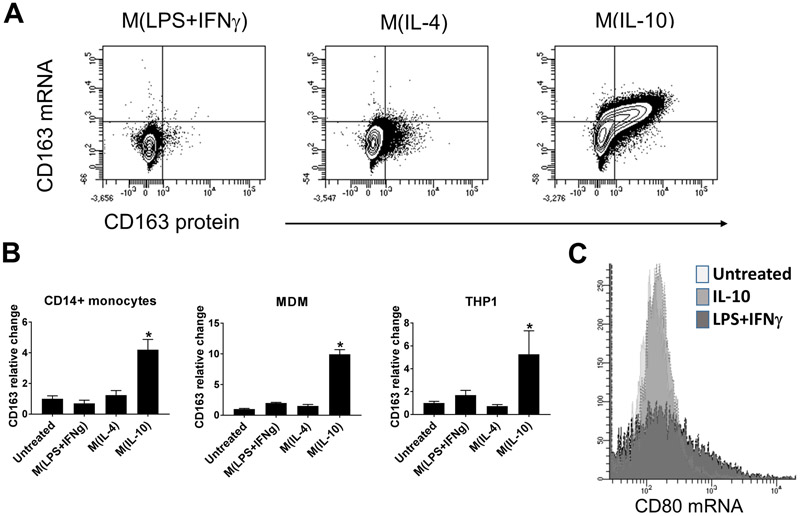
Figure 2. IL-10 specifically increases expression of CD163 mRNA and protein.
(A) Flow cytometry of CD163 mRNA (Alexa647) and protein (PE) expression in THP-1 cells cultured under macrophage polarizing conditions as indicated. Images are representative of two independent experiments. (B) Real time PCR for CD163 mRNA in CD14+ monocytes (left), MDMs (center), or THP-1 cells (right) treated under specific macrophage polarizing conditions for 24 hours as indicated. Bars represent relative fold change to untreated monocytes. Error bars indicate SEM. * = P < 0.05, one-way ANOVA with follow-up Tukey multiple comparisons test for M(IL-10) vs untreated. Data are representative of three independent experiments performed in triplicate. (C) Flow cytometry of CD80 mRNA (Alexa647) levels in THP-1 cells cultured for 24h under the indicated conditions. Data are representative of two independent experiments.

