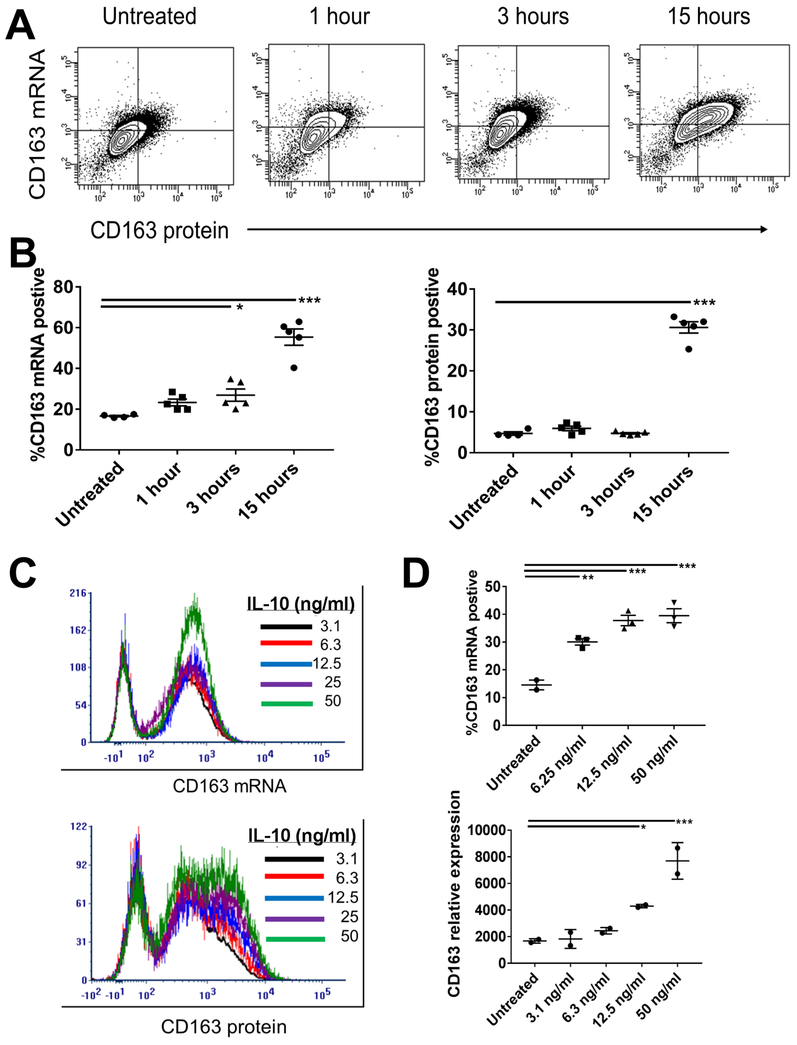
Figure 3. Time and Dose Response of CD163 mRNA and protein to IL-10 stimulations in THP-1 cells.
(A) Representative flow cytometry analysis of CD163 mRNA (AF647) and protein (PE) was performed following IL-10 stimulation of THP-1 cells for the indicated hours. (B) Figures indicate the percent of positive cells for CD163 mRNA (left) or protein (right) after the indicated time of treatment with IL-10. Data are pooled from five experiments. (C) Representative plots of CD163 mRNA (top) and protein (bottom) analysis by flow cytometry following overnight stimulation with IL-10 at the indicated dosages. (D) CD163 mRNA detection by flow cytometry (top) and real time PCR (bottom) from three experiments. Error bars represent SEM. *p<0.05; **p<0.01; ***P<0.001, one-way ANOVA with follow-up Dunnett’s multiple comparisons test vs untreated.

