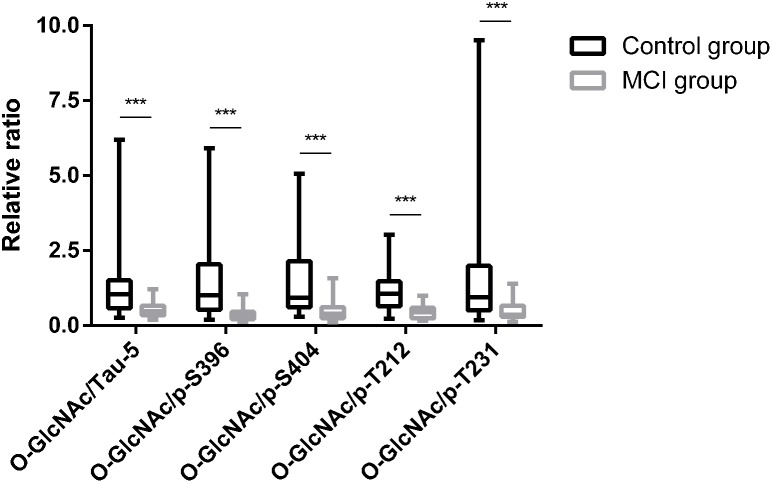
FIGURE 2.
Relative ratio of global O-GlcNAcylation to tau phosphorylation levels in T2DM subjects. O-GlcNAc/Tau-5, O-GlcNAc/p-S396, O-GlcNAc/p-S404, O-GlcNAc/p-T212, and O-GlcNAc/p-T231 were all decreased in T2DM with MCI subjects in comparison to control subjects. All data represents n = 48, and are median (interquartile range). ∗∗∗p < 0.001.

