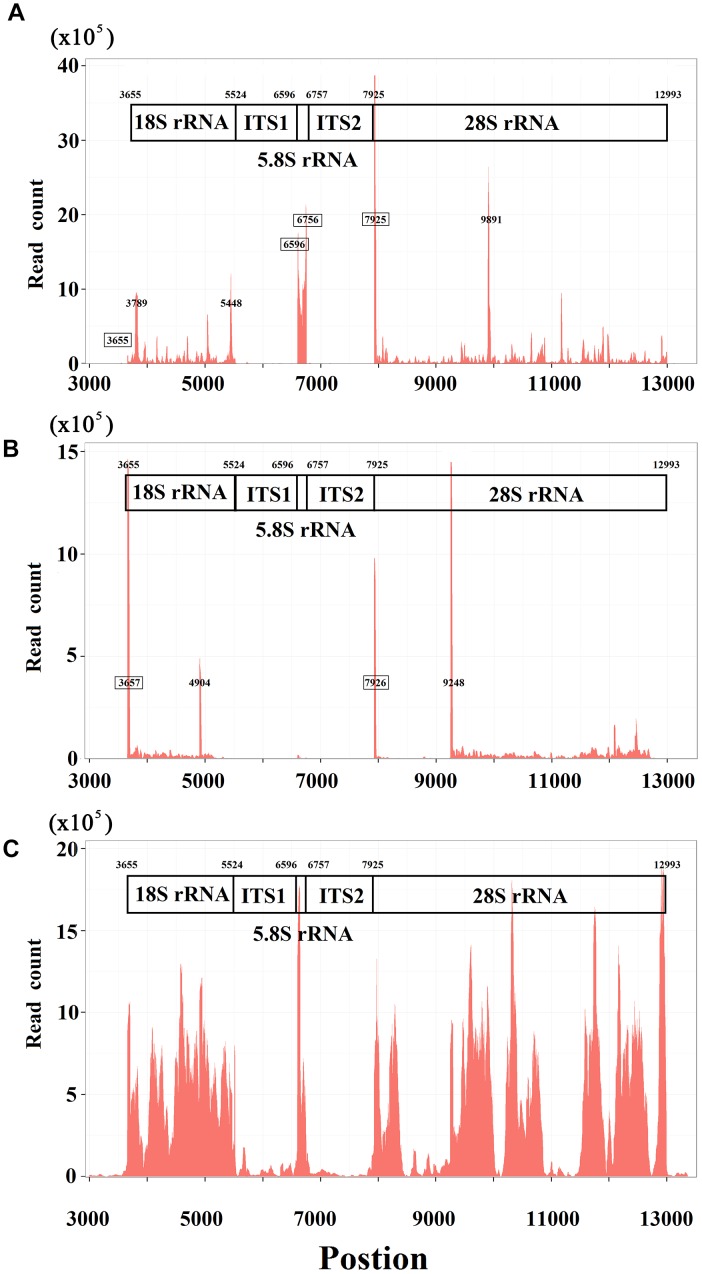
FIGURE 2.
Genome-alignment maps using sRNA-seq, Cage-seq, and GRO-seq. This figure shows the count distribution of all aligned reads on the reference rRNA sequence (RefSeq: NR_046235.1). These reads are from one sRNA-seq dataset (A) one CAGE-seq dataset (B) and one GRO-seq dataset (C) the description of these datasets can be seen in the Section “Materials and Methods.” The identified 5′ and 3′ ends of mature RNAs are marked by boxes.

