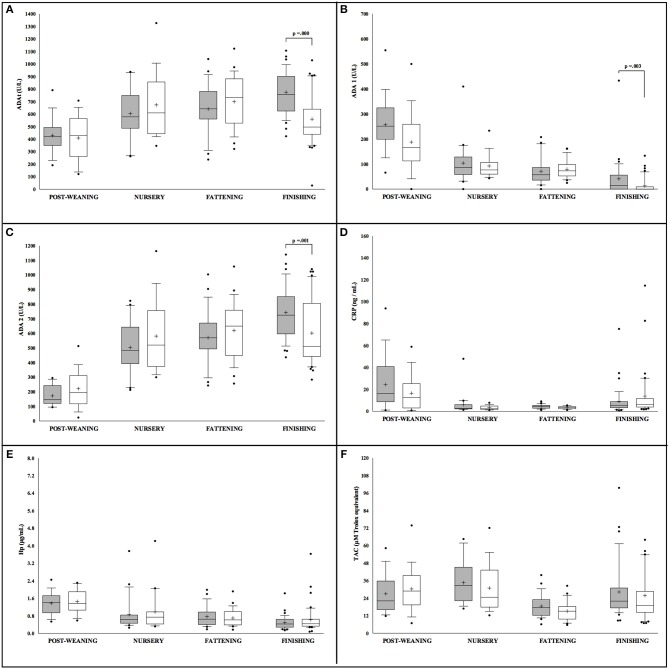
Figure 2.
Concentration of the salivary analytes studied in Iberian pigs (n = 207) separated according to sex (white = males and gray = females) and farming stages (X axis). Box-and-whisker plot showing median (horizontal line inside box), mean (plus symbol), 25 and 75 percentiles (edge of box), 10 and 90 percentiles (whiskers), and individual data points beyond (filled circle); significant pairwise comparisons are noted (adjusted p). The salivary analytes determined were ADAt (A), ADA1 (B), ADA2 (C), CRP (D), Hp (E) and TAC (F).

