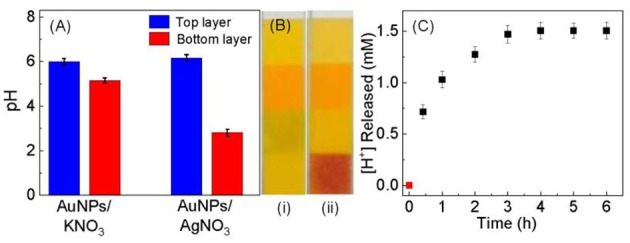
Figure 5.

(A) Bar plot showing the pH change occurring in solution after the addition of KNO3 and AgNO3. 30 mL of dialyzed AuNPs was centrifugation precipitated and split into two equal volume portions. Those two are AuNP-free top layer and AuNP-containing bottom layer. pH measurements were conducted 1 h after incubating top and bottom layer with 10 mM KNO3 and AgNO3. (B) Photograph of the pH papers used to check the pH of the Ag+ treated (i) top and (ii) bottom layers, respectively. (C) Time-dependent proton concentration as a function of the (AgNO3/AuNP) incubation time. The sample was prepared by mixing 10 mM of AgNO3 with 30 mL of dialyzed AuNPs that were centrifugation precipitated before AgNO3 addition.
