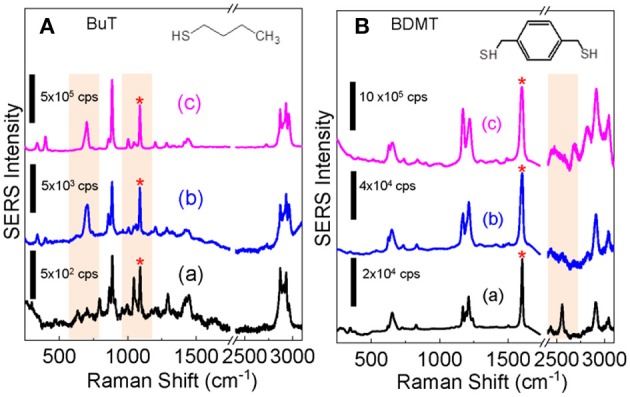
Figure 6.

Comparison of the SERS spectra obtained for (A) BuT and (B) BDMT with dialyzed AuNPs (a) before and (b) after the Ag+ staining, (c) is the SERS spectra obtained with AgNPs. The structure of BuT and BMDT are also shown. The SERS spectra are normalized to the peak denoted by “*”.
