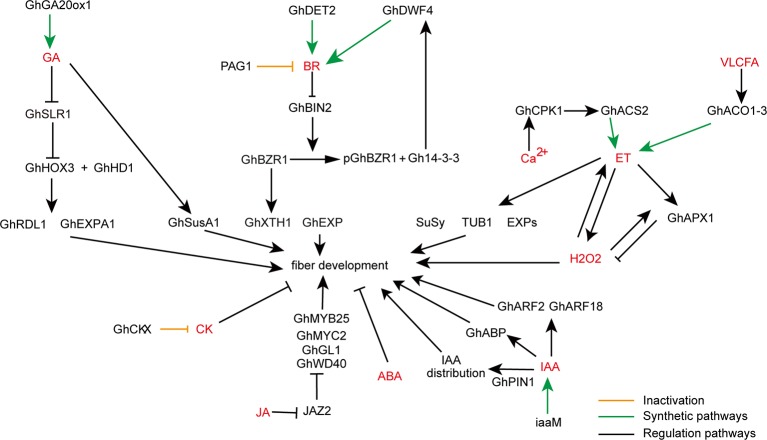
Figure 1.
A schematic model showing the roles of various phytohormones during cotton fiber development. Arrows show promotion actions and bars ends show inhibitory actions. Yellow lines indicate inactivation pathway, green lines indicate synthetic pathway, and black lines indicate regulation pathway. GA, gibberellic acid; BR, brassinosteroids; VLCFA, very long-chain fatty acid; ET, ethylene; H2O2, hydrogen peroxide; CK, cytokinin; ABA, abscisic acid; JA, jasmonic acid; IAA, indoleacetic acid.

