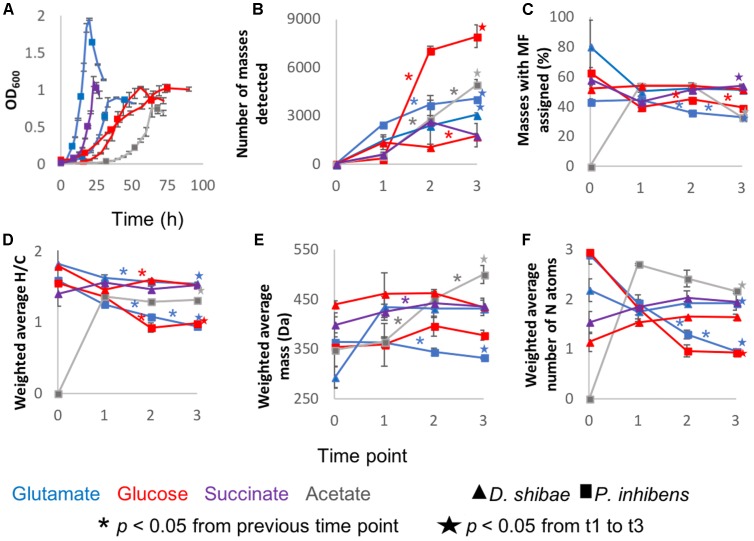
FIGURE 1.
General description of the incubations: Averages of the three biological replicates of (A) Optical density measured at 600 nm wavelength. (B) Average number of detected masses in at least two biological replicates. (C) From the detected masses, the percentage to which molecular formulas (MF) were assigned. (D) Intensity-weighted average elemental ratios of hydrogen and carbon (E) Intensity-weighted average size of the masses detected via FT-ICR-MS. The reported number is the mean of the size averages of the three biological replicates (F) Intensity-weighted average of nitrogen atoms. Error bars represent standard deviation among the biological triplicates. The ∗ are added in the color coding of the substrate above the line to which they correspond and indicate that the difference between those two time points is statistically significant with p < 0.05. The star, also color coded, means that the difference between time points 1 and 3 is statistically significant with p < 0.05 and it is depicted above the final time point.

