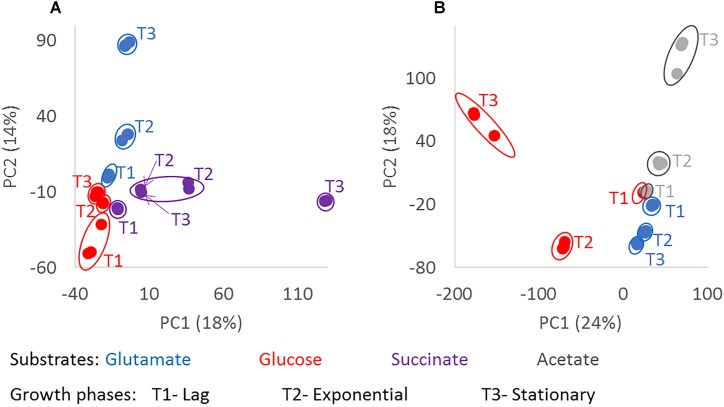
FIGURE 3.
Chemodiversity of exometabolomes diverging with growth phase and substrate. Principle component analysis was done from the normalized intensities of the detected molecular masses in the exometabolome of D. shibae (A) and P. inhibens (B). Masses detected in at least two biological replicates were considered. The color code indicates the substrate used as carbon source by the bacteria; glutamate in blue, glucose in red, succinate in purple and acetate in gray; where T1 is lag phase, T2 is exponential phase, and T3 is stationary phase. The composition of the exometabolomes of both strains changed significantly with p-value < 0.001 (∗∗∗) for growth phase and substrate.

