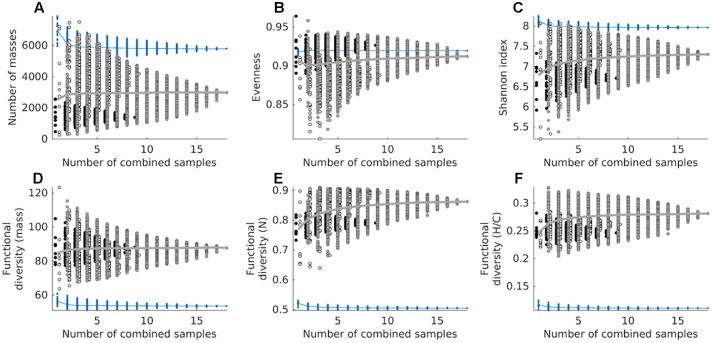
FIGURE 6.
Cumulative chemodiversity of exometabolomes and marine DOM samples corrected by MDL, assessed as: (A) the number of molecular masses (richness), (B) Pielou’s evenness, (C) the Shannon index and (D) functional diversity of molecular mass, (E) functional diversity of number of N atoms, and (F) functional diversity of H/C ratios. Diversity measures (A–D) are based on detected masses, whereas (E,F) are based on assigned MF. Note that we added a small set-off between samples from different strains to minimize overlapping. A total of 262,143 combinations were tested for both datasets (exometabolomes and marine DOM). Circles filled black represent combinations of D. shibae exometabolomes exclusively, circles filled white represent combinations of P. inhibens exometabolomes exclusively, and circles filled gray represent combinations of exometabolomes from both strains. The mean of exometabolomes is given as a gray line. Blue dots represent combinations from repeated measurements of the North Equatorial Pacific Intermediate Water sample, its mean is given as a blue line.

